SmartArt – Create Your Own Illustrations In 5 Steps
Create your own graphics to illustrate information with little effort!

Pictures say more than a thousand words. Microsoft probably thought so too and created a way for you to create your own graphics with little effort, which are used to illustrate lists, processes, hierarchies and much more and bundle information in one image.
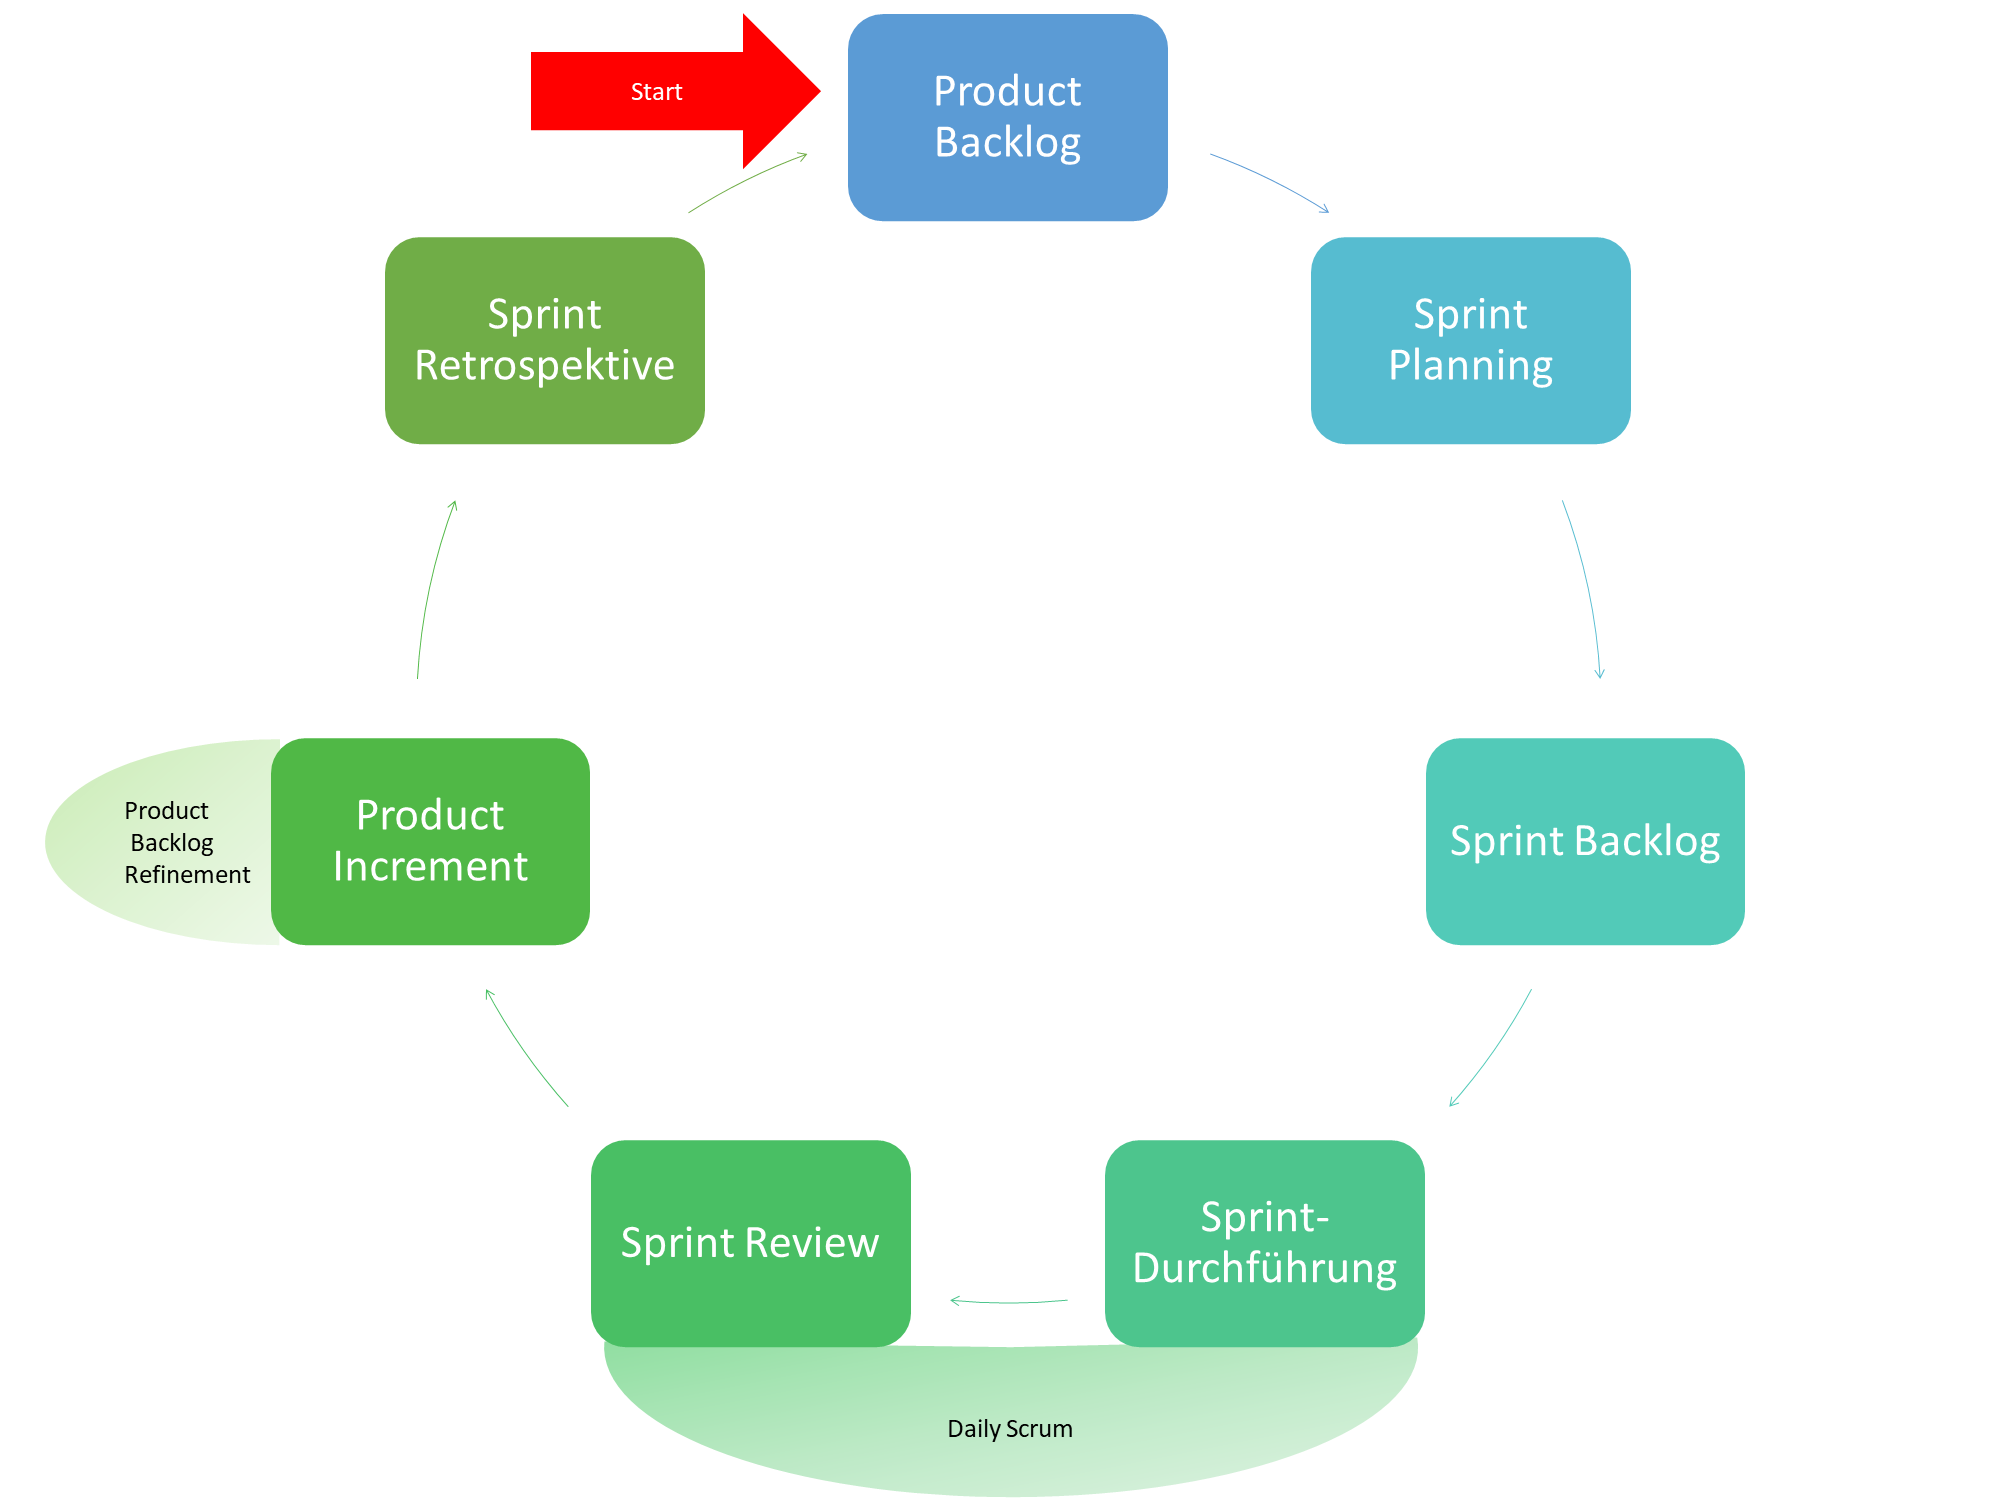
Using the Scrum process as an example, we will take a look at the possibilities that the SmartArt function has to offer.
Step 1: Insert SmartArt Graphic
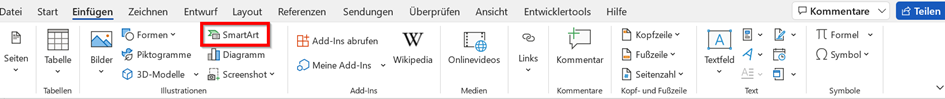
You can reach the "SmartArt" menu item in PowerPoint, Word and Outlook via Insert --> SmartArt .
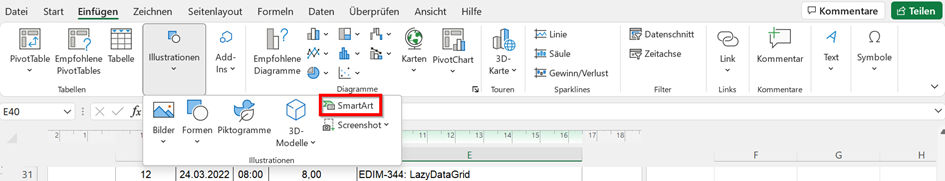
In Excel you can reach the menu item via Insert --> Illustrations --> SmartArt
Here you get a selection of predefined illustration types (layouts).
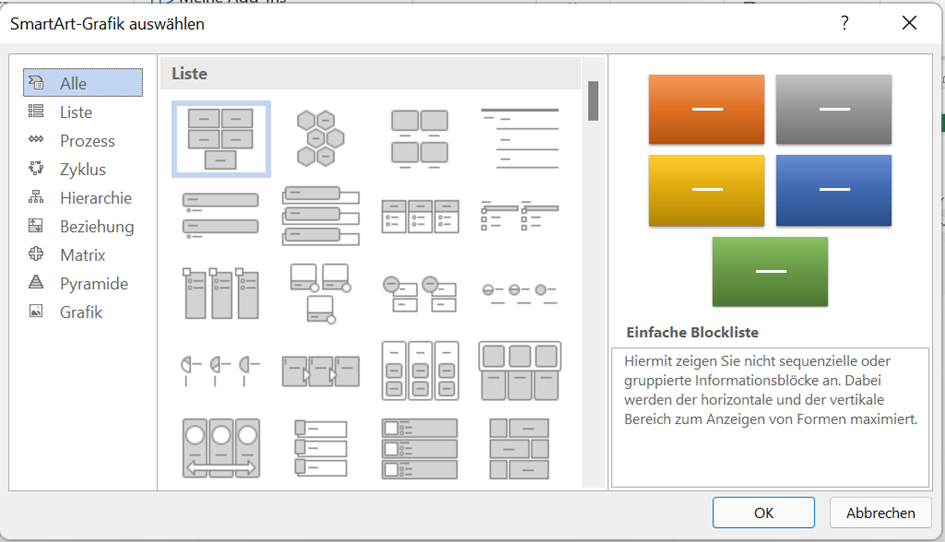
In the case of our Scrum process, we decide on a cycle, select it and click OK.
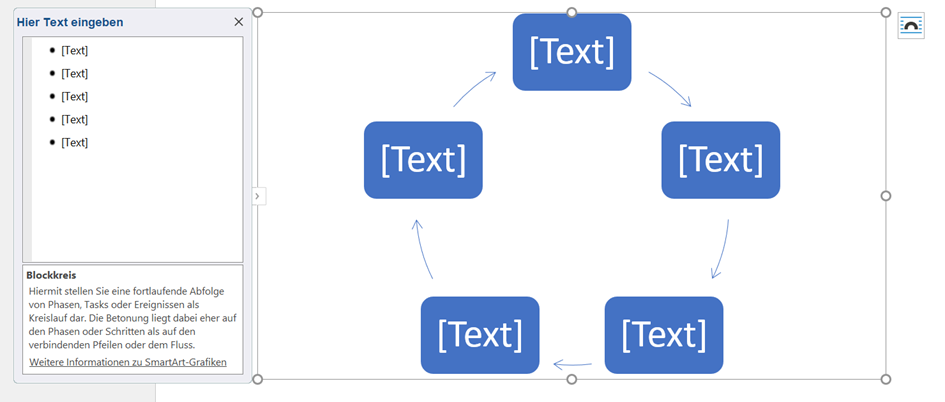
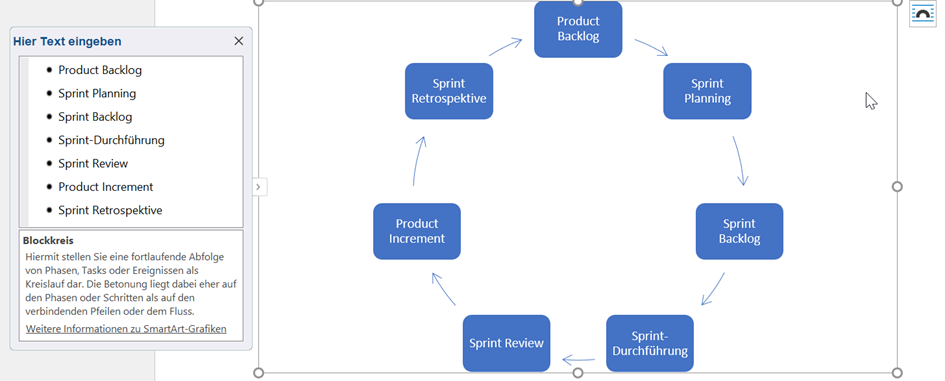
Step 2: Adding Texts
If the window for the input ("Enter text here") is not automatically visible, there are two ways to show the window:
- Right-click the graphic and select Show Text Area
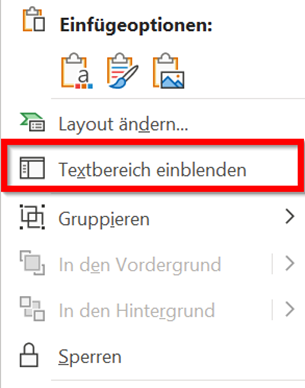
2. Via the SmartArt menu item (select the graphic with the left mouse button so that the menu item appears)
Next, we define the individual process steps. In some of the layouts, sub-items can be created with the Tab key, which also lead to the creation of another element. However, sub-items are not necessary for our (simplified) Scrum process.
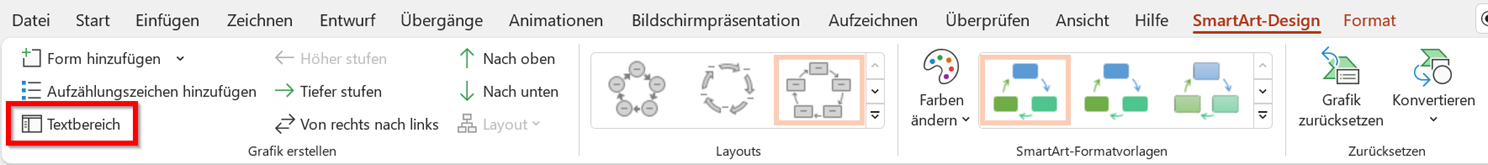
The SmartArt Design Menu Item
Now let's look at the SmartArt button on the menu bar. This will appear once you select the SmartArt shape:
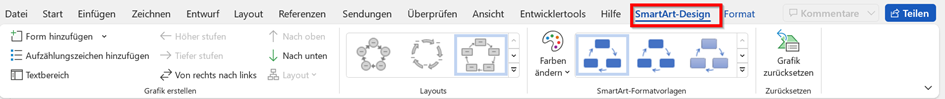
The most important functions here are:
- changing the layout (changing the entire layout of the SmartArt graphic - e.g. from cycle to bulleted)
- changing the theme (changing colors)
- resetting the shape - all changes are reset to their original state
- adding more shapes or text
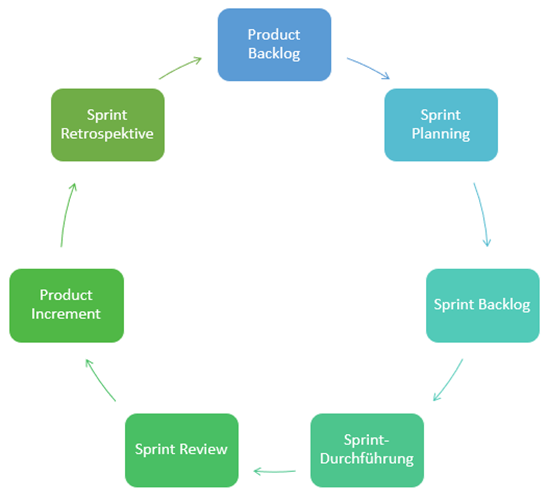
Step 3: Changing The Color Scheme
We'll color-match our graphic by choosing a different color scheme under Change Colors:
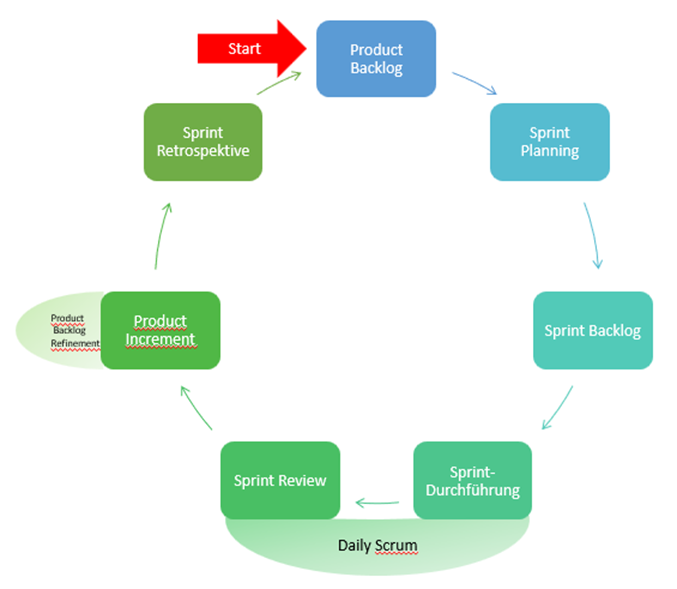
Step 4: Add More Shapes
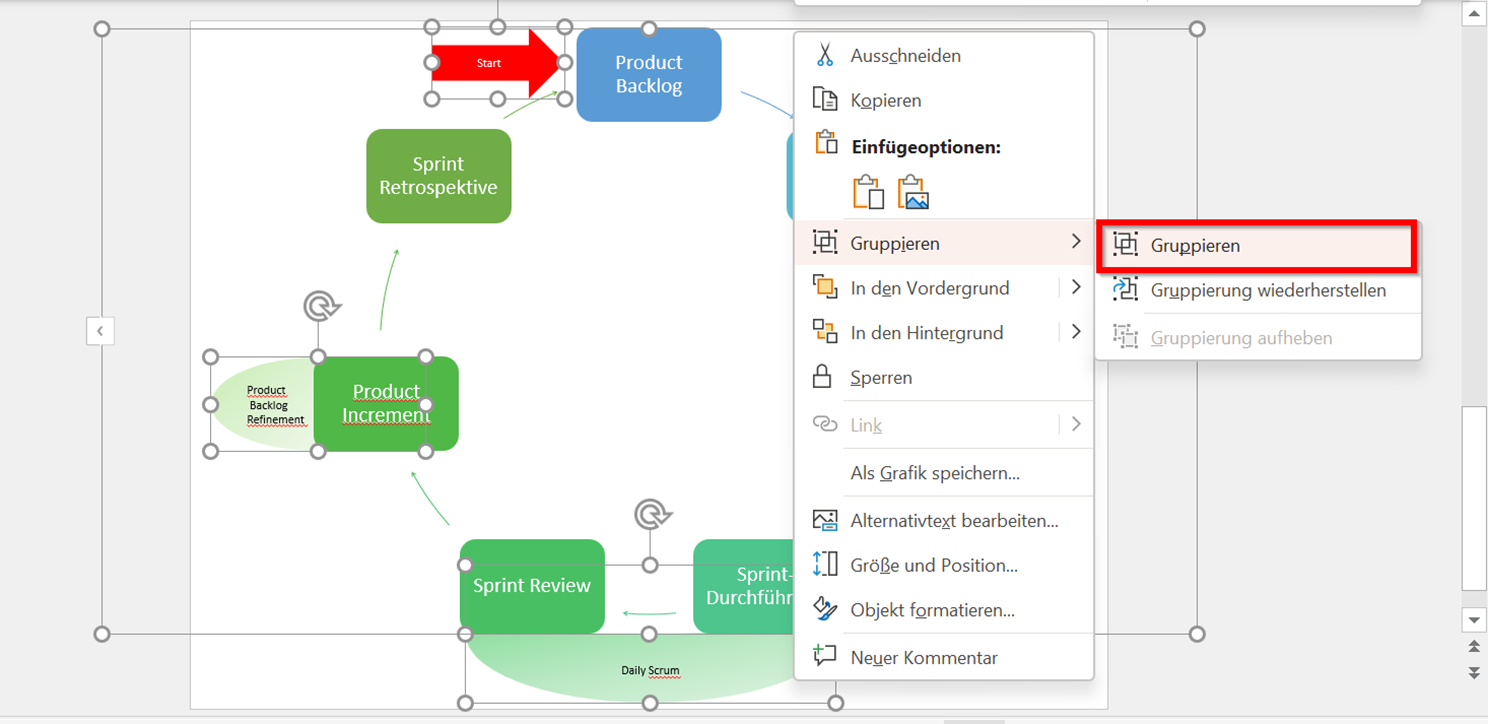
For our scrum process we need a few more shapes. We add these as usual via the menu item Insert --> Shapes . We also remove the frame on the individual elements.
Step 5: Export The SmartArt Graphic As An Image File
Once the graphic is ready, we can convert it to an image file for further use. There are two ways to do this.
Via The Menu Item File --> Export
In PowerPoint, we can export our image by going to the File menu --> Export --> Change file type --> PNG (Portable Network Graphics) and clicking the Save As... button.
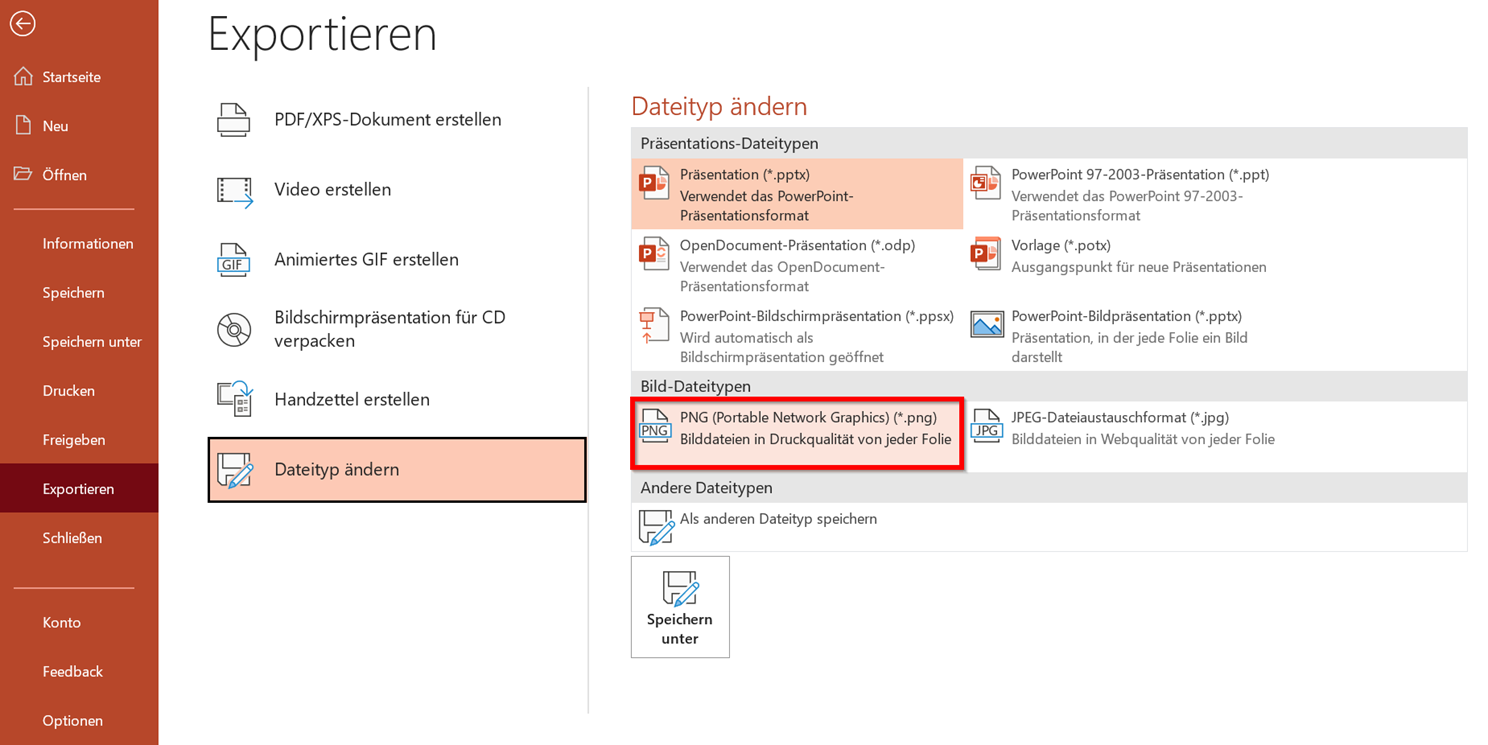
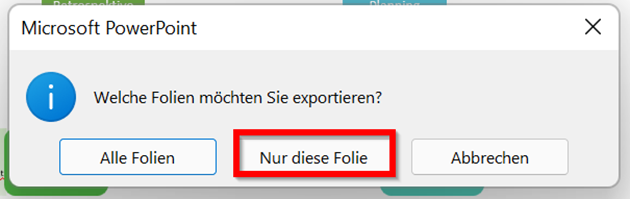
Now we need to choose the file location and name. Finally, PowerPoint asks us which slides we want to export. We choose This slide only .
Right-Click --> Save As Graphic...
We can also export the image by right-clicking on it and then choosing Save as Image...
Conclusion
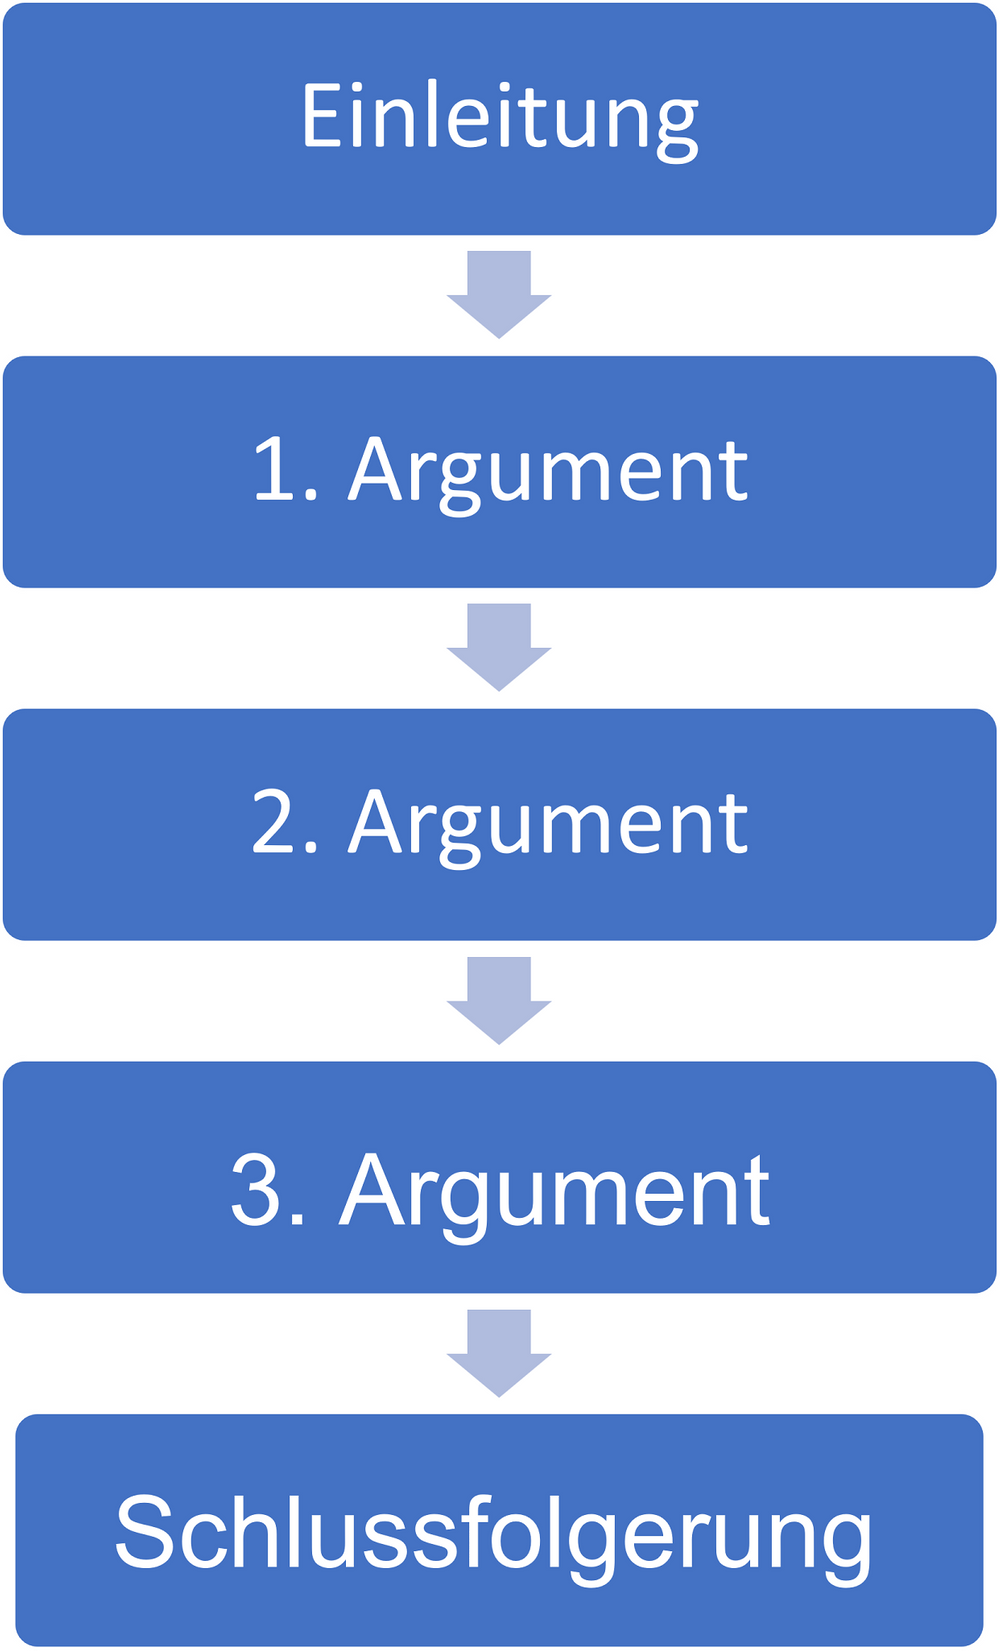
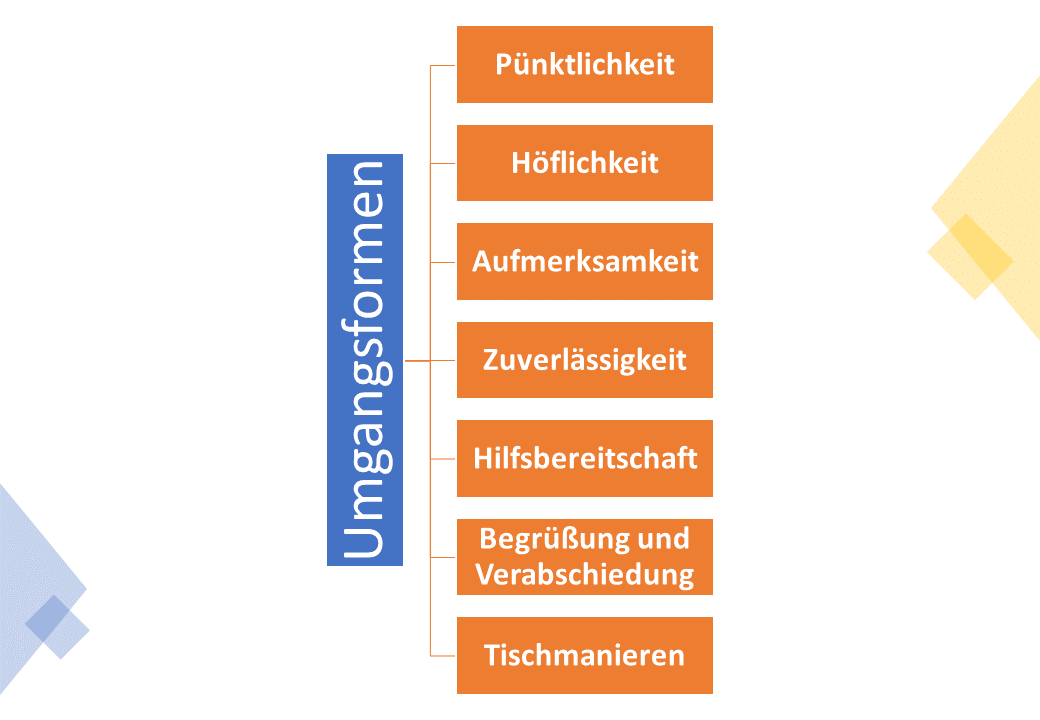
With the SmartArt function of the Office package, you can create your own beautiful illustrations with little effort. They are suitable for hierarchies, lists, enumerations and much more. Give it a try!
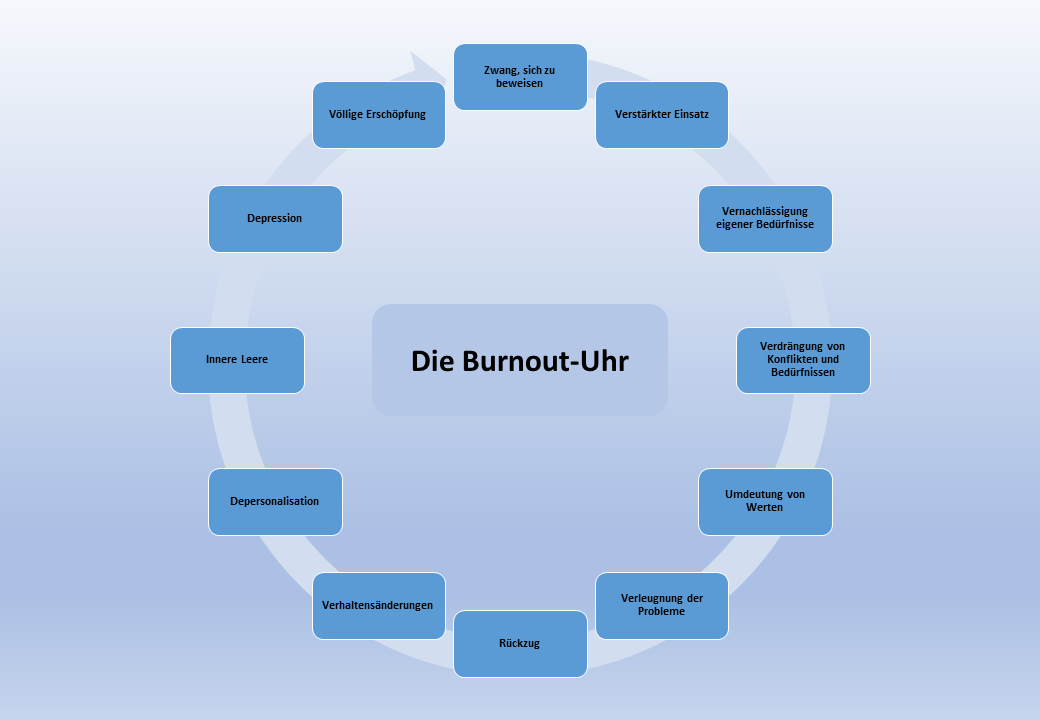
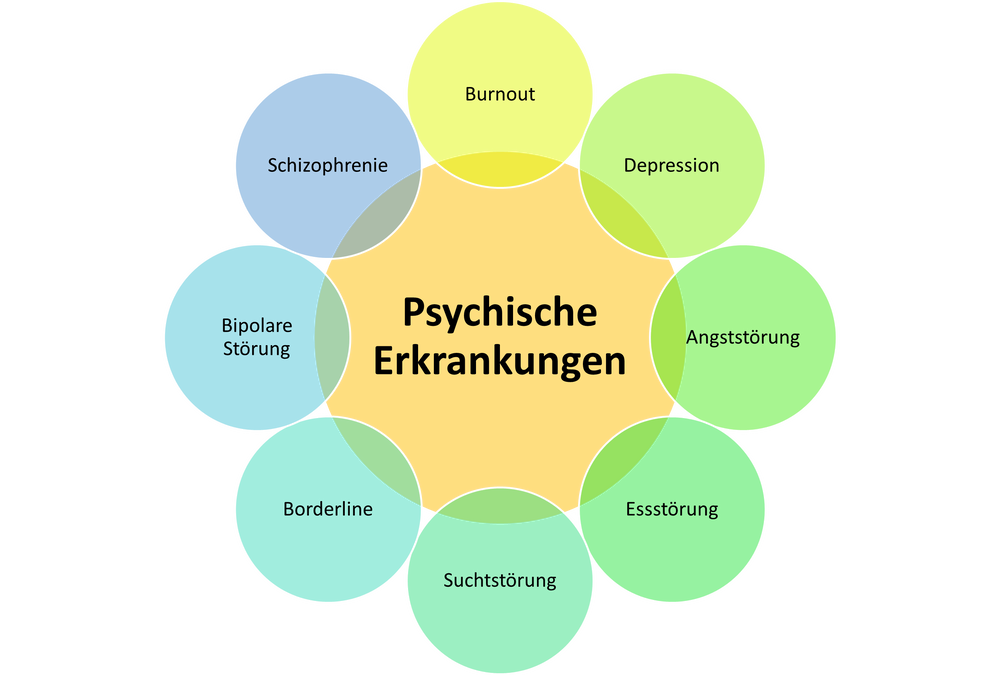
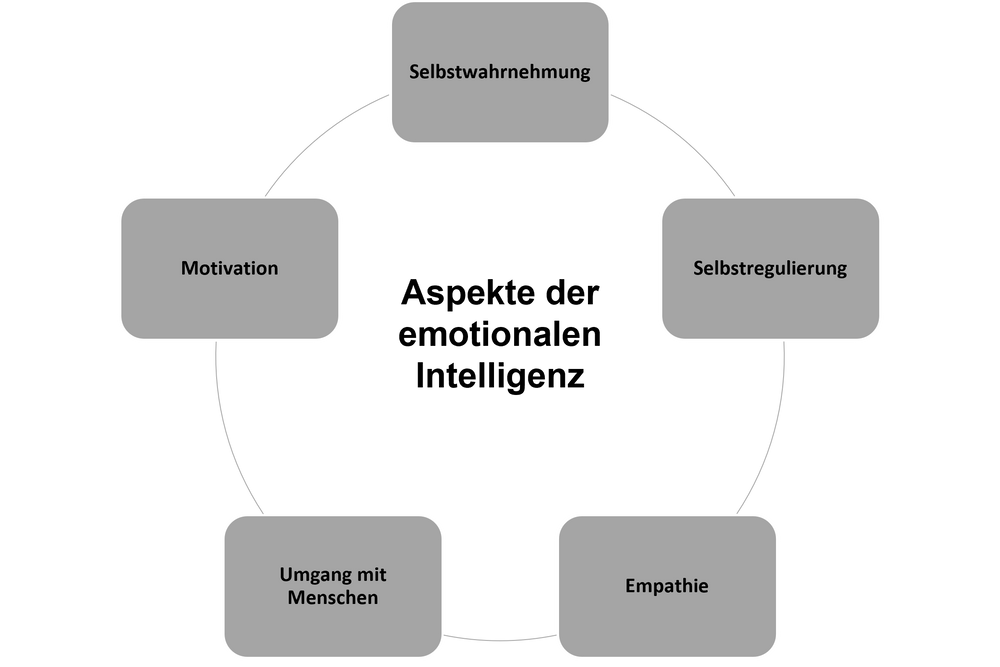
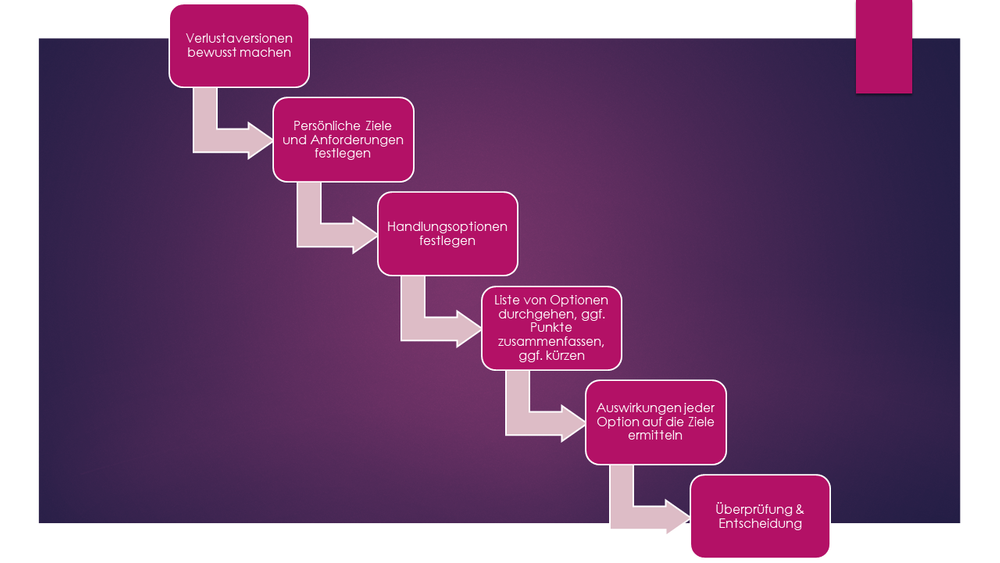
More SmartArt Examples